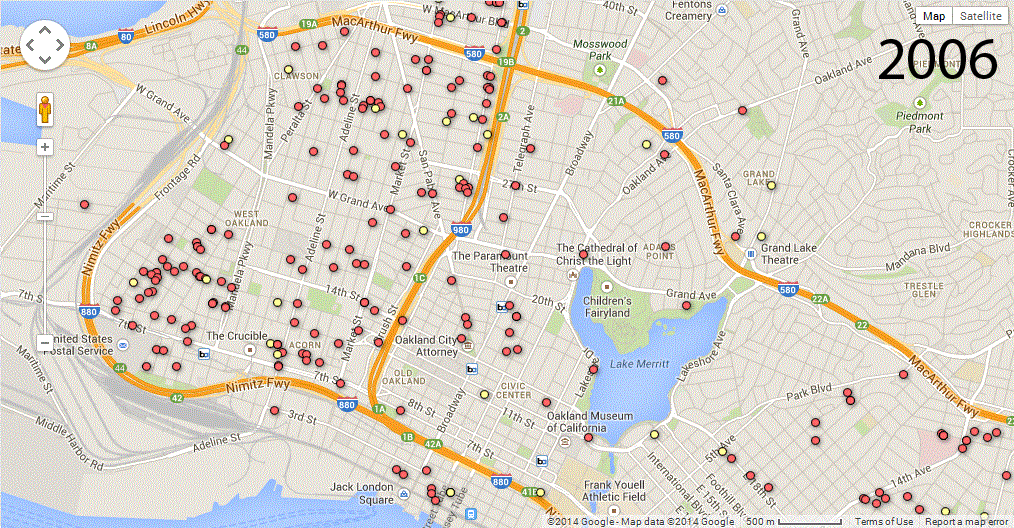
Animated Map of Shootings and Homicides in Downtown and West Oakland, 2006-2011 by Scott Morris | Posted on February 23, 2014June 27, 2019 Homicides are in yellow, injury and non-injury shootings are in red. Scott MorrisScott Morris is an independent journalist in Oakland covering policing, protest and civil rights. This website is entirely supported by donation. You can support these ongoing reporting projects via PayPal or Patreon.
June 10, 2019 Expensive and Dangerous: Vallejo police may pay more per officer in civil rights cases than any other agency